Tuesday, July 1, 2025
MindNell - Health & Wellness News
No Result
View All Result
  • Home
  • Health Conditions
    • Cardiovascular
    • Autism
    • Cancer
    • COPD
    • Dementia
    • Digestive Health
  • Wellness
    • Youth’s Health & Wellness
    • Women’s Health & Wellness
    • Men’s Health & Wellness
    • Aging Health & Wellness
    • Sexual Health & Wellness
    • Pregnancy & Postnatal
    • Mental Health
      • Anxiety & Depression
      • ADHD
    • LGBTQI+
  • Fitness & Gym
    • Work Out
    • Yoga & Pilates
  • Parenting
  • Food & Nutrition
    • Healthy Drinks
    • Healthy Recipes
    • Vegans
  • Weight Loss
  • Lifestyle
    • Travel
  • Health & Wellness STORE
MindNell
No Result
View All Result
Home Health Conditions Cardiovascular

The Triglyceride/HDL Cholesterol Ratio

MindNell by MindNell
17 June 2025
in Cardiovascular
0
The Triglyceride/HDL Cholesterol Ratio
0
SHARES
0
VIEWS
Share on FacebookShare on PinterestShare by Email


Estimated reading time: 14 minutes

Author’s Note:

This article was initially published in 2014. Since then, a growing body of research has strengthened the case for using the triglyceride-to-HDL cholesterol (TG/HDL-C) ratio as a simple, powerful marker of cardiometabolic risk. This 2025 update brings new clinical insight, clearer explanations, and a narrative approach to help readers understand why this ratio matters more than ever.

For decades, cholesterol has been the headline act in our understanding of heart disease. High LDL-cholesterol (LDL-C) — the so-called “bad” cholesterol — was cast as the main villain, while HDL-cholesterol (HDL-C) earned praise as the “good” kind. Statins became the blockbuster therapy, and LDL-C targets the cornerstone of prevention guidelines.

But heart disease is more nuanced than a single number.

LDL-C tells us something — but not everything. Many patients with metabolic dysfunction carry substantial cardiovascular risk, even when their cholesterol levels appear “normal.” Their danger lies not just in how much cholesterol they carry, but in how it’s packaged.

Case in Point: John’s Heart Attack Wasn’t Predicted by LDL-C

Marvin was 52, tied to a desk, with a widening waistline. His LDL-C was 116 mg/dL (3.0 mmol/L) — “normal,” according to his doctor. But he had a strong family history of heart disease, borderline blood pressure, and signs of metabolic stress.

His labs showed triglycerides at 210 mg/dL (2.4 mmol/L), HDL-C at 38 mg/dL (1.0 mmol/L) — a TG/HDL-C ratio of 5.5. That ratio is a red flag for insulin resistance and an atherogenic lipid profile, often overlooked when LDL-C is the sole focus.

No further steps were taken.

Six months later, John had a heart attack. A ruptured plaque in his LAD artery triggered a clot that blocked blood flow to a large part of his heart.

The warning was there, just not recognized.

A high TG/HDL-C ratio is a strong marker of insulin resistance and an atherogenic lipoprotein profile, meaning it reflects a pattern that promotes plaque formation in the arteries. Yet it’s often ignored in favor of LDL-C alone.

Despite mounting evidence, the triglyceride-to-HDL cholesterol (TG/HDL-C) ratio remains underrecognized in clinical practice. Multiple studies have found the TG/HDL-C ratio to be a stronger predictor of cardiovascular risk than LDL-C alone, particularly in individuals with metabolic syndrome, obesity, or type 2 diabetes.

This article examines why the TG/HDL-C ratio warrants greater clinical attention: what it reveals about lipoprotein behavior, what the science says, and how it fits into a more accurate, metabolically informed approach to cardiovascular risk assessment.

Understanding Lipoproteins: The Real Players

When people say, “My cholesterol is normal,” they usually mean their LDL-C — the amount of cholesterol inside LDL particles — looks okay on their lab report. But that number doesn’t always tell the whole story.

Here’s why.

Cholesterol can’t float freely in the blood. It’s a fat, and fat doesn’t mix with water. So the body packages it into tiny particles called lipoproteins — protein-coated carriers that transport not just cholesterol, but also triglycerides and phospholipids, to and from cells.

You can think of them as delivery trucks in your bloodstream.

There are different kinds:

  • Chylomicrons carry fat from food after you eat.
  • VLDL (very-low-density lipoproteins) deliver triglycerides made in the liver.
  • LDL (low-density lipoproteins) carry mostly cholesterol.
  • HDL (high-density lipoproteins) help remove excess cholesterol from the bloodstream.
  • Lp(a) [Lipoprotein(a)] is a genetically determined LDL-like particle linked to increased cardiovascular risk.

Now here’s the key insight: some of these trucks are more dangerous than others, especially small, dense LDL particles. They can more easily penetrate the arterial wall, become oxidized, and trigger inflammation. Over time, this contributes to the buildup of plaque and the development of atherosclerosis.

The LDL-C Problem

LDL-C tells you how much cholesterol is inside LDL particles — but it doesn’t tell you how many particles are present. That’s a problem, because a patient may have low LDL-C but still carry a high number of small, dense LDL particles — each only lightly loaded with cholesterol, but still atherogenic.

This mismatch, when particle number is high but cholesterol content appears “normal,” is called lipid discordance. Studies consistently show that cardiovascular risk tracks more closely with the number of particles than with the total cholesterol they carry.

LDL-P and ApoB: Two Ways to Count the Trucks

So, how do we measure the number of atherogenic lipoproteins?

There are two validated ways:

  • LDL-P (LDL particle number), measured via nuclear magnetic resonance (NMR)

  • Apolipoprotein B (ApoB), a protein carried on every atherogenic particle, including VLDL, IDL, LDL, and Lp(a)

Every one of these particles carries exactly one molecule of ApoB. So while LDL-P gives you a particle count from one subclass (LDL), ApoB gives you the total count of all atherogenic particles.

The two markers correlate closely, and both are stronger predictors of cardiovascular risk than LDL-C.

The next step is to understand what the TG/HDL-C ratio can tell us, and why it’s so practical.

The Lipid Panel: What We Measure and What We Miss

The standard lipid panel has been a cornerstone of cardiovascular risk assessment for decades. It measures:

  • Total cholesterol
  • LDL cholesterol (LDL-C)
  • HDL cholesterol (HDL-C)
  • Triglycerides (TG)

Importantly, LDL-C is not measured directly in most cases — it’s typically calculated using the Friedewald formula, which estimates LDL-C based on total cholesterol, HDL-C, and triglycerides. This approach is most effective when triglyceride levels are within the normal range and the patient is fasting; however, its reliability decreases at high triglyceride levels or in individuals with metabolic disturbances.

LDL-C has historically received the most attention — and with good reason. Numerous studies have linked elevated LDL-C with increased risk of heart disease, and LDL-lowering therapies like statins have proven benefits.

The LDL-C problem becomes especially important in people with metabolic syndrome, insulin resistance, or type 2 diabetes. These individuals often have a seemingly normal LDL-C, yet elevated cardiovascular risk. Why? Because they tend to have high levels of triglyceride-rich lipoproteins (like VLDL), low HDL, and a high number of small, dense LDL particles.

The standard panel misses this pattern — unless you know where to look.

The Clue in the Ratio

The TG/HDL-C ratio offers a simple but powerful clue. It reflects underlying lipid dynamics that the LDL-C number can’t capture, particularly in people with metabolic dysfunction.

A high TG/HDL-C ratio is often a sign of:

  • Increased VLDL secretion
  • Reduced HDL-mediated reverse cholesterol transport
  • Smaller, denser LDL particles
  • Higher likelihood of elevated ApoB and LDL particle number

In other words, the ratio can unmask atherogenic dyslipidemia — a common but often overlooked driver of cardiovascular disease.

Why Use TG/HDL-C Instead of ApoB or LDL-P

While ApoB and LDL particle number (LDL-P) provide more direct measurements of atherogenic burden, they require advanced testing that is not available everywhere and often comes with additional costs.

In contrast, the TG/HDL-C ratio is calculated from the standard lipid panel, which is routinely ordered in clinical practice. It costs nothing extra, requires no special lab equipment, and still offers valuable insight into lipoprotein size, particle number, and metabolic health.

It’s not a perfect substitute, but it’s a practical, powerful tool hiding in plain sight.

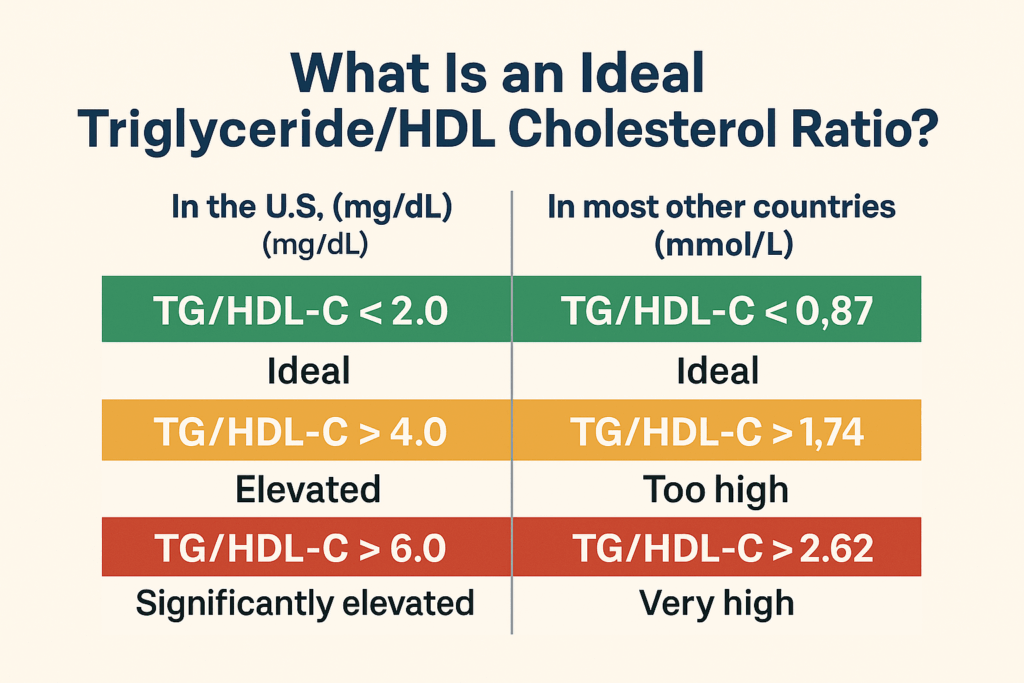
What Is an Ideal TG/HDL-C Ratio?

The triglyceride-to-HDL cholesterol ratio is easy to calculate:
Just divide your fasting triglycerides by your HDL cholesterol — using the same units.

However, there is one crucial detail: different countries report lipids in different units.

In the U.S. (mg/dL):

  • TG/HDL-C → Ideal

  • TG/HDL-C > 4.0 → Elevated

  • TG/HDL-C > 6.0 → Significantly elevated, suggests atherogenic dyslipidemia

In most other countries (mmol/L):

To convert mg/dL to mmol/L, multiply your ratio by 0.4366.
Or, if you’re going the other way (mmol/L → mg/dL), multiply by 2.3.

📌 Note: In this article, we use the U.S. convention (mg/dL) unless otherwise specified.

What the TG/HDL-C Ratio Tells Us About LDL Particles 

One of the most fascinating — and clinically useful — insights about the TG/HDL-C ratio is its ability to reveal the type of LDL particles in circulation.

As we’ve seen, not all LDL particles are created equal. Some are large and buoyant, others small and dense. And that difference matters.

Why Particle Size Matters

Small, dense LDL particles are more atherogenic. They’re:

People with insulin resistance, abdominal obesity, or metabolic syndrome often have a predominance of these small, dense LDL particles — even when their LDL-C is “normal.”

The Ratio Predicts Particle Size

Several studies have shown that the TG/HDL-C ratio correlates with LDL particle size. One found that:

  • Among people with a TG/HDL-C ratio above 3.8, about 80% had a predominance of small, dense LDL

  • Among those with a ratio below 3.8, about 80% mainly had large, buoyant LDL

This makes sense biochemically.

When triglycerides are elevated — often due to excess VLDL — an exchange occurs: triglycerides move from VLDL into LDL and HDL, while cholesteryl ester moves in the opposite direction. This transformation leaves LDL and HDL particles enriched in triglycerides and depleted in cholesterol.

Then, when lipases remove those excess triglycerides, the particles shrink, leaving behind smaller, denser LDL.

Particle Number Still Matters More

Size alone isn’t the whole story. While small LDL particles are more dangerous on a per-particle basis, the number of LDL particles (LDL-P) — or their surrogate, ApoB — is often a stronger predictor of cardiovascular risk.

Fortunately, a high TG/HDL-C ratio usually reflects both small particle size and high particle number, especially in the context of metabolic disease.

So while the TG/HDL-C ratio doesn’t directly measure ApoB or LDL-P, it points us in the same direction, often with remarkable accuracy.

Same LDL-C, Different Risk: This illustration shows how two people can have identical LDL cholesterol levels (150 mg/dL) but very different cardiovascular risks depending on the size and number of LDL particles. Large, buoyant LDL (Pattern A) is associated with lower risk, while small, dense LDL (Pattern B) is more atherogenic, highlighting why particle characteristics matter more than total cholesterol alone.

TG/HDL-C Ratio and Insulin Resistance

The link between the TG/HDL-C ratio and insulin resistance may be one of the most important — and underappreciated — aspects of this simple marker.

Insulin resistance occurs when the body’s cells no longer respond properly to insulin. The result? The pancreas must produce more insulin to achieve the same effect. Over time, this leads to hyperinsulinemia, fat accumulation (especially visceral fat), and a cascade of metabolic disruptions that increase cardiovascular risk.

The Lipid Signature of Insulin Resistance

Insulin resistance often comes with a distinct lipid fingerprint:

  • Elevated triglycerides
  • Low HDL-C
  • Normal or mildly elevated LDL-C
  • Small, dense LDL particles
  • Elevated ApoB

In this context, the TG/HDL-C ratio becomes a practical, indirect marker of insulin resistance — one that can be flagged from a standard lipid panel.

Supporting Evidence

Multiple studies have demonstrated a strong correlation between the TG/HDL-C ratio and insulin resistance, particularly in overweight individuals of European descent. For example:

  • One study found that a TG/HDL-C ratio ≥3.0 (mg/dL) was a reliable predictor of insulin resistance in Caucasian adults.

  • Other research has linked higher TG/HDL-C ratios to increased fasting insulin levels, higher HOMA-IR scores, and elevated risk of type 2 diabetes.

However, the relationship is not universal. In some ethnic groups, such as African Americans, the TG/HDL-C ratio may be less reliable as a marker of insulin resistance due to population-specific lipid patterns.

Still, the broader trend holds: as the TG/HDL-C ratio rises, so does the likelihood of insulin resistance — and its downstream effects on vascular and metabolic health.

Why Use TG/HDL-C Instead of ApoB or LDL-P

Insulin resistance is a central feature of metabolic syndrome, prediabetes, type 2 diabetes, and non-alcoholic fatty liver disease (NAFLD) — all of which are associated with increased cardiovascular risk.

Identifying it early is essential.

And while there are more direct ways to measure insulin resistance, such as fasting insulin or HOMA-IR, these are not routinely ordered in primary care. The TG/HDL-C ratio, in contrast, is already available on every standard lipid panel.

That makes it a practical, low-cost window into a silent but dangerous process.

How to Improve Your TG/HDL-C Ratio 

Improving your triglyceride-to-HDL cholesterol ratio means lowering triglycerides, raising HDL-C — or ideally, both. The good news? These changes often come from the same set of lifestyle interventions.

But first, a key insight:
A poor TG/HDL-C ratio isn’t just a lab abnormality — it’s often a reflection of insulin resistance and disrupted metabolic health. Fixing the ratio often means addressing the deeper cause.

What Works

1. Lose visceral fat.
Even modest weight loss can significantly lower triglycerides and improve HDL-C. The most impactful target is visceral (abdominal) fat, which drives insulin resistance and the overproduction of VLDL.

2. Cut added sugars, especially fructose.
Excess sugar, especially in the form of fructose (including high-fructose corn syrup), raises triglyceride levels by stimulating hepatic lipogenesis. Fruit is fine; soda is not.

3. Shift from high-carb to lower-carb eating.
Low-fat, high-carbohydrate diets often raise triglycerides and lower HDL-C, worsening the TG/HDL-C ratio. In contrast, low-carbohydrate or Mediterranean-style diets consistently improve it.

4. Prioritize omega-3 fats.
Omega-3 fatty acids (from fatty fish or supplements) reduce triglyceride levels. They may also have a favorable effect on VLDL metabolism and HDL particle function.

5. Exercise, especially aerobically.
Regular physical activity improves insulin sensitivity and increases HDL-C, even if triglycerides are only modestly affected. Movement matters.

6. Avoid excess alcohol.
Alcohol, especially in excess, can dramatically raise triglycerides, particularly in people with underlying insulin resistance or fatty liver.

7. Don’t smoke.
Smoking lowers HDL-C and worsens insulin sensitivity. Quitting has a direct, measurable benefit on lipid ratios.

Final Thought

Improving the TG/HDL-C ratio isn’t about chasing a number. It’s about restoring a healthier metabolic pattern — one with fewer triglyceride-rich particles, better HDL function, and lower atherogenic risk.

The best part? You don’t need a specialized test to find the signal.
The TG/HDL-C ratio is already there, hiding in plain sight on your standard lipid panel.

Related Reading on Doc’s Opinion

  • Atherogenic Dyslipidemia (link)
  • When High LDL Leads to Heart Disease — And When It Doesn’t (link)
  • The 12-Step Biology of Atherosclerosis (link)
  • LDL-C vs. LDL-P: What’s the Difference? (link)
  • What’s the Best Lipid Marker to Predict Risk? (link)
  • Apolipoprotein B and Heart Disease (link)
  • High Triglycerides — And How to Lower Them (link)
  • VLDL, Triglycerides & Remnant Cholesterol (link)
  • HDL Cholesterol — The Good, the Misunderstood (link)
  • 10 Pitfalls of Using LDL-C to Assess Risk (link)
  • LDL Particle Number vs. Size — Made Easy (link)
  • LDL-P (link)
  • Metabolic Syndrome and Insulin Resistance (link)

References

  1. de Almeida‑Pititto B, Branda JI, de Oliveira JM, Dualib PM, de Aquino Fernandes Dias LB, Bensenor IM, Lotufo PA, Ferreira SRG. The Predictive Value of the Triglycerides/HDL‑Cholesterol Ratio for Diabetes Incidence. Endocrines. 2024;5(3):418–429. Link
  2. Yokoyama K, Tani S, Matsuo R, Matsumoto N. Increased triglyceride/high‑density lipoprotein‑cholesterol ratio may be associated with reduction in the low‑density lipoprotein particle size: assessment of atherosclerotic cardiovascular disease risk. Heart Vessels. 2019;34(2):227–236. Link
  3. Figueiredo N, de Oliveira Queiroz M, Lopes KLS, Oliveira L, Dâmaso AR, de Melo PRE, de Souza Abreu V, Mota JF, Horst MA, Corgosinho FC. Triglyceride‑to‑High‑Density‑Lipoprotein‑Cholesterol Ratio as a Predictor of Metabolic Syndrome According to Stage of Life at Obesity Onset in Women with Severe Obesity—A Pilot Study. Obesities. 2022;2(4):361–371. Link
  4. Da Luiz et al. High ratio of triglycerides to HDL‑C predicts extensive coronary disease. Clinics. [Epub ahead of print; 2022]. Link
  5. Editorial. TG/HDL-c Ratio as a Predictor of Cardiovascular Risk. Int J Cardiol Sci. [Epub ahead of print]. Link
  6. Kosmas CE et al. The Triglyceride/High‑Density Lipoprotein Cholesterol (TG/HDL‑C) Ratio as a Marker of Metabolic Syndrome and Cardiovascular Disease: A Review. Sci Rep. 2023; (Issue not specified):[pages not specified]. Link
  7. Chen Z et al. The association between triglyceride to high‑density‑lipoprotein cholesterol ratio and calcific aortic valve disease. BMC Cardiovasc Disord. 2024;24(1):372. Link
  8. Yuge H et al. Triglycerides/HDL‑C ratio as a stronger predictor of type 2 diabetes incidence. PMCID: PMC10634002. 2023;[Epub ahead of print]. Link
  9. McLaughlin T, Reaven G, Abbasi F, Lamendola C, Saad M, Waters D. Is there a simple way to identify insulin‑resistant individuals at increased risk of cardiovascular disease? Am J Cardiol. 2005;96(3):399–404. Link
  10. Sumner AE, Finley KB, Genovese DJ, Criqui MH, Boston RC. Fasting triglyceride and the triglyceride-HDL cholesterol ratio are not markers of insulin resistance in African Americans. Arch Intern Med. 2005 Jun 27;165(12):1395-400. doi: 10.1001/archinte.165.12.1395. PMID: 15983289. Link
  11. Bittner V, Johnson BD, Zineh I, Rogers WJ, Vido D, Marroquin OC, Bairey-Merz CN, Sopko G. The triglyceride/high-density lipoprotein cholesterol ratio predicts all-cause mortality in women with suspected myocardial ischemia: a report from the Women’s Ischemia Syndrome Evaluation (WISE). Am Heart J. 2009 Mar;157(3):548-55. doi: 10.1016/j.ahj.2008.11.014. PMID: 19249427; PMCID: PMC2677623. Link
  12. da Luz PL, Cesena FH, Favarato D, Cerqueira ES. Comparison of serum lipid values in patients with coronary artery disease at 70 years of age. Am J Cardiol. 2005 Dec 15;96(12):1640-3. doi: 10.1016/j.amjcard.2005.07.080. Epub 2005 Oct 21. PMID: 16360350. Link
  13. Zhou L, Mai J, Li Y, Guo M, Wu Y, Gao X, Wu Y, Liu X, Zhao L. Triglyceride to high-density lipoprotein cholesterol ratio and risk of atherosclerotic cardiovascular disease in a Chinese population. Nutr Metab Cardiovasc Dis. 2020 Sep 24;30(10):1706-1713. doi: 10.1016/j.numecd.2020.05.009. Epub 2020 May 23. PMID: 32811737. Link
  14. Cordero A, Andrés E, Ordoñez B, León M, Laclaustra M, Grima A, Luengo E, Moreno J, Bes M, Pascual I, Civeira F, Pocoví M, Alegría E, Casasnovas JA; MEtabolic Syndrome Active Subjects Study Investigators. Usefulness of triglycerides-to-high-density lipoprotein cholesterol ratio for predicting the first coronary event in men. Am J Cardiol. 2009 Nov 15;104(10):1393-7. doi: 10.1016/j.amjcard.2009.07.008. PMID: 19892056. Link
  15. Chapman MJ, Ginsberg HN, Amarenco P, Andreotti F, Borén J, Catapano AL, Descamps OS, Fisher E, Kovanen PT, Kuivenhoven JA, Lesnik P, Masana L, Nordestgaard BG, Ray KK, Reiner Z, Taskinen MR, Tokgözoglu L, Tybjærg-Hansen A, Watts GF; European Atherosclerosis Society Consensus Panel. Triglyceride-rich lipoproteins and high-density lipoprotein cholesterol in patients at high risk of cardiovascular disease: evidence and guidance for management. Eur Heart J. 2011 Jun;32(11):1345-61. doi: 10.1093/eurheartj/ehr112. Epub 2011 Apr 29. PMID: 21531743; PMCID: PMC3105250. Link
  16. Otvos JD, Mora S, Shalaurova I, Greenland P, Mackey RH, Goff DC Jr. Clinical implications of discordance between low-density lipoprotein cholesterol and particle number. J Clin Lipidol. 2011 Mar-Apr;5(2):105-13. doi: 10.1016/j.jacl.2011.02.001. PMID: 21392724; PMCID: PMC3070150. Link


Discover more from Doc’s Opinion

Subscribe to get the latest posts sent to your email.


Source link

Previous Post

Korean Scientists Develop Marbled Cultivated Meat Using Self-Healing Scaffolding Technology – vegconomist

Next Post

Book explores why research on Alzheimer's and depression has not translated into better treatments – Medical Xpress

MindNell

MindNell

Next Post
John C. Fremont Healthcare District Board of Directors Special Meeting Agenda for Tuesday, June 2, 2025 – Sierra Sun Times

Book explores why research on Alzheimer's and depression has not translated into better treatments - Medical Xpress

RelatedTopics

Strawberry hack for kids! #fruit #strawberry #parenting #food #hacks #useful #parentingtips

Strawberry hack for kids! #fruit #strawberry #parenting #food #hacks #useful #parentingtips

1 July 2025
John C. Fremont Healthcare District Board of Directors Special Meeting Agenda for Tuesday, June 2, 2025 – Sierra Sun Times

Plasma vitamin D binding protein as the potential predictor of depressive disorder risk in breast cancer patients – Nature

1 July 2025
John C. Fremont Healthcare District Board of Directors Special Meeting Agenda for Tuesday, June 2, 2025 – Sierra Sun Times

Rural healthcare AI | Partner voice | Microsoft’s supersmart medical AI, LLMs don’t really care, more – aiin.healthcare

1 July 2025
Better Balance to Supply Plant-Based Proteins for Papa John’s Pizzas in Spain and Portugal – vegconomist

Better Balance to Supply Plant-Based Proteins for Papa John’s Pizzas in Spain and Portugal – vegconomist

1 July 2025
Be The Most Charismatic Person In Any Room! # #psychologyhacks #psychology # #manipulation

Be The Most Charismatic Person In Any Room! # #psychologyhacks #psychology # #manipulation

1 July 2025
Queerty Crossword: June 17, 2025

Queerty Crossword: July 1, 2025

1 July 2025
MindNell

© 2025 MindNell  

Navigate Site

  • Privacy & Policy
  • Contact Us

Follow Us

No Result
View All Result
  • Home
  • Health Conditions
    • Cardiovascular
    • Autism
    • Cancer
    • COPD
    • Dementia
    • Digestive Health
  • Wellness
    • Youth’s Health & Wellness
    • Women’s Health & Wellness
    • Men’s Health & Wellness
    • Aging Health & Wellness
    • Sexual Health & Wellness
    • Pregnancy & Postnatal
    • Mental Health
      • Anxiety & Depression
      • ADHD
    • LGBTQI+
  • Fitness & Gym
    • Work Out
    • Yoga & Pilates
  • Parenting
  • Food & Nutrition
    • Healthy Drinks
    • Healthy Recipes
    • Vegans
  • Weight Loss
  • Lifestyle
    • Travel
  • Health & Wellness STORE

© 2025 MindNell